“Everything good, everything magical happens between the months of June and August.” Jenny Han, writer of The Summer I Turned Pretty trilogy
- The start of the second half of the year looked much like the first half, with the S&P 500 gaining 2% over a holiday-shortened week.
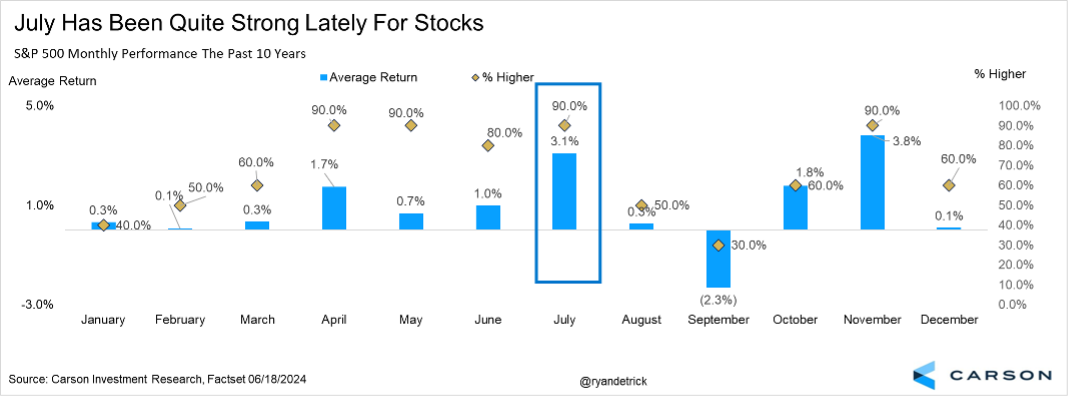
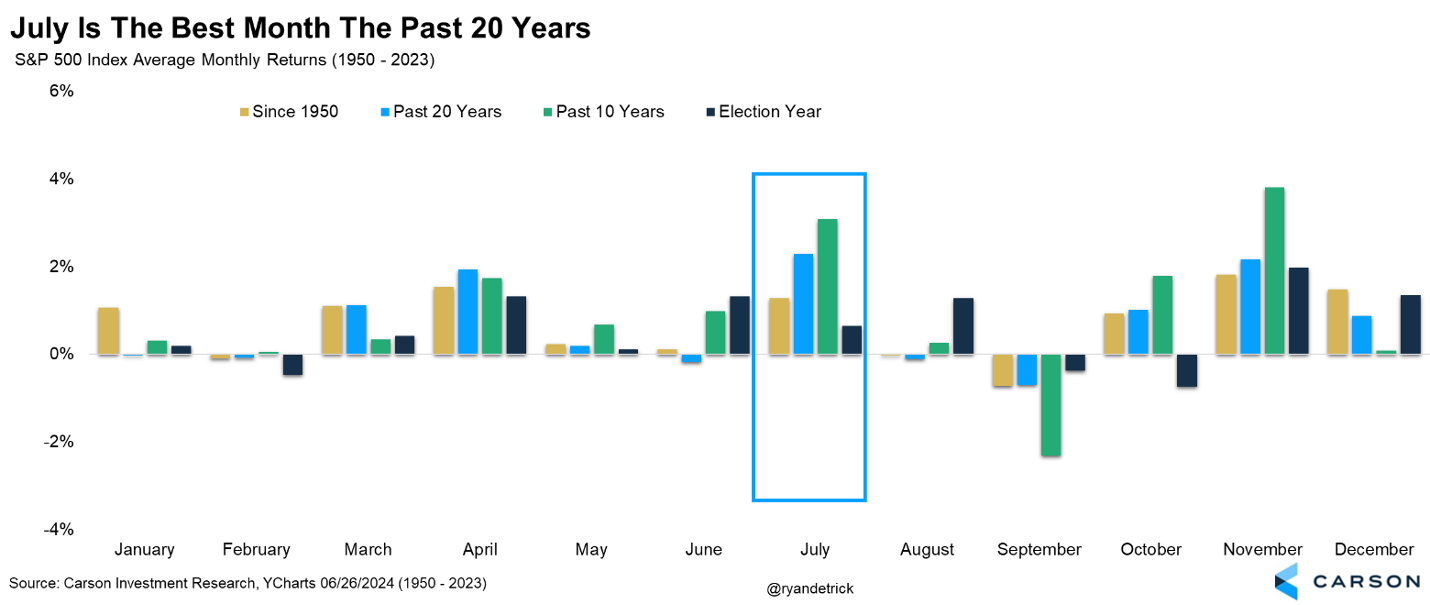
- July has been the best month of the year over the last 20 years and second best over the last 10.
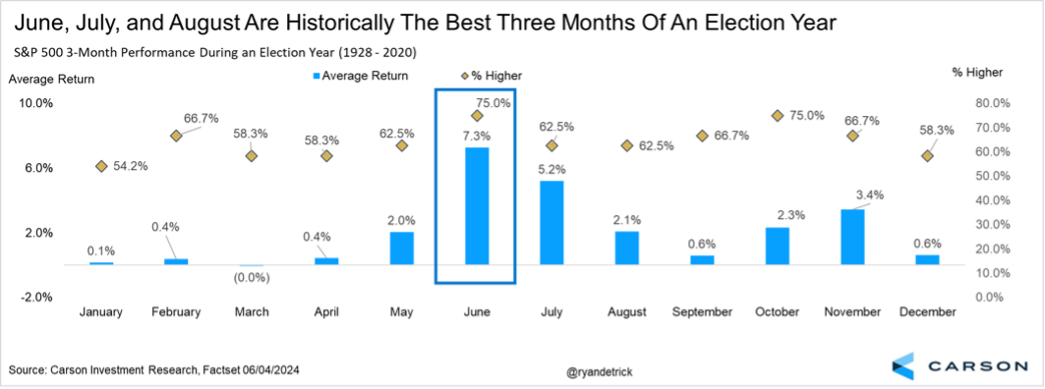
- The summer months of June, July, and August have also been strong months in election years.
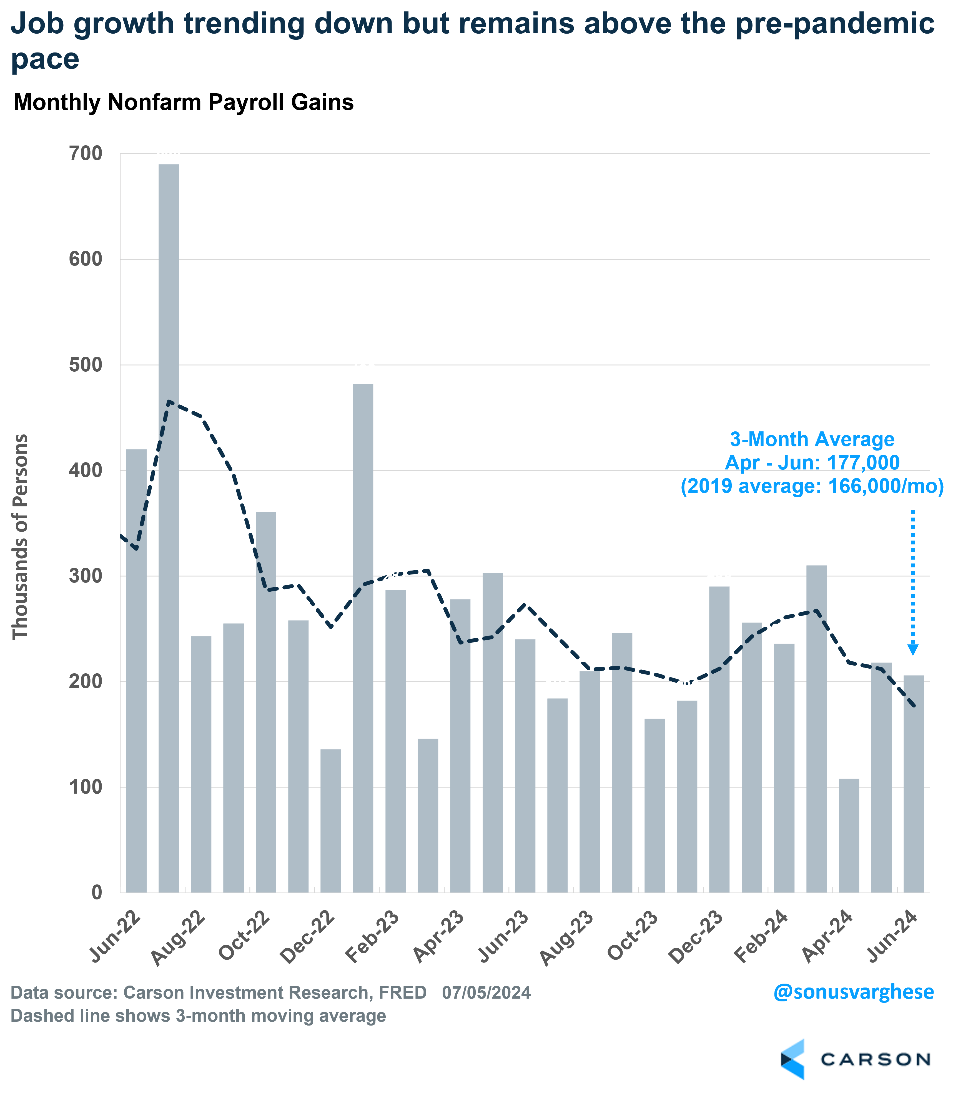
- The economy added 206,000 jobs in June, ahead of expectations of 190,000.
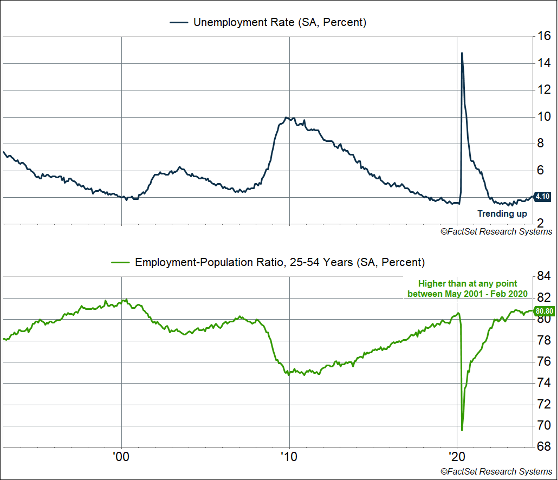
- Layoffs remain very low but the unemployment rate has been creeping higher.
- The labor market remains healthy but risks are rising and the Fed should be getting closer to cutting rates, with the first cut likely coming in September.
After gaining close to 5% in May, the S&P 500 had another very solid month in the usually weak month of June, gaining 3.6%. We had pushed against the majority view that a rough summer was coming, and here we are. This week we’ll look at why we think the surprise summer rally isn’t quite done yet, but first we’ll discuss how rare June was and a few other interesting stats.
The worst day in June for the S&P 500 was a 0.4% decline on the last day of the month. Think about that, the worst day all month was down only 0.4%!? That is the best ‘worst day of the month’ since November 2019 and second best since February 2017!
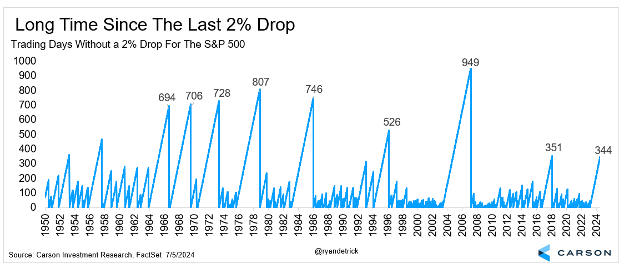
Not to be outdone, the S&P 500 hasn’t had a 2% daily decline for a very, very long time. In fact, the last time it fell 2% or more in one day was way back in February 2023! Although this could suggest we are long in the tooth for some volatility, look at this chart we made that showed there have been some streaks that have actually lasted much longer.\
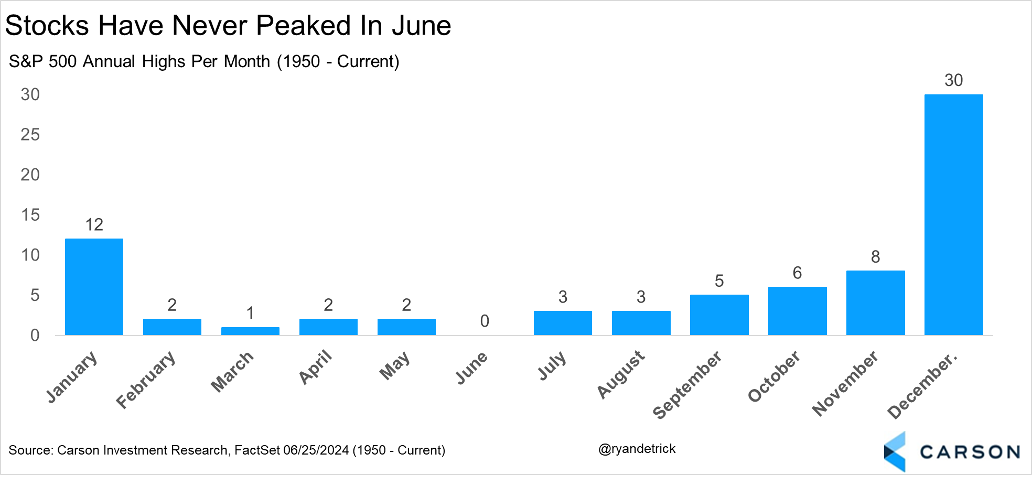
Something else to consider is stocks rarely peak for the year in June. In fact, since 1950 it has never happened. We won’t pretend to know why this is, but we won’t argue with it and this is another nice feather in the cap for the bulls. (In fact, this has already held true for 2024, since the S&P 500 has already made a new all-time high in July.)
Let’s now look at how stocks historically do in July. Well, lately July has been about as good as it gets, with the S&P 500 up an incredible nine years in a row in July and 11 of the past 12 years. That might sound like a lot, but it actually was up 11 years in a row from 1949 to ’59 and it had eight in a row back in the 1930s and ‘40s. Long win streaks apparently are quite normal for the month. In fact, in the past 10 years July is the second best month on average, with only November better.
Things have been even better the last 20 years, with July the S&P 500’s strongest month gaining an average of 2.3%.
As we’ve mentioned many times lately, summer rallies in election years are quite common. In fact, the S&P 500 has gained more than 7% on average in an election year in June, July, and August. For those thinking this summer rally is running on fumes, we’d argue there still could be some left in the tank.
Why in the world has July been so strong lately? Is it random? Is it people like summer? Or is it something else? We think part of it is driven by stock fundamentals—July is the start of second quarter earnings season. It seems like every year we come into the year with all the bowtie-wearing economists telling us how bad everything is. Yet by the time we get around to second quarter earnings season low expectations are often confronted by corporate America once again finding a way to top low expectations. It’s the triumph of capitalist pragmatism over idle theory. Doers are optimists. Thinkers are pessimist. Fortunately, the doers drive the economy; the thinkers only report on it.
Is It Time to Worry About Employment?
We’ve noted in the past how the US economy primarily relies on consumer spending, and since consumer spending is driven by income growth, the employment situation is pretty much the ballgame. And right now, things are getting a tad uncomfortable. We’re not quite worried yet, but simply recognize that risks are rising.
Despite the concerns, payroll growth has been running strong month after month. The economy created 206,000 jobs last month, above expectations for a 190,000 increase. These numbers can and will be revised, and so it helps to look at the 3-month average. That number has been trending down since earlier this year, but it’s at a healthy 177,000 right now, above the 166,000 average pace in 2019.
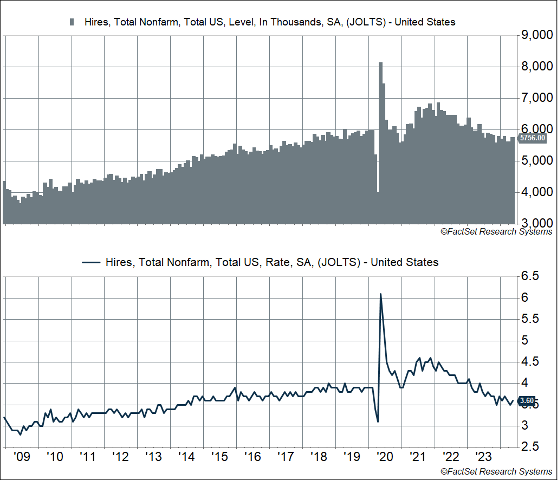
The payroll growth numbers quoted above are “net employment numbers,” i.e. overall hiring net of separations, whether voluntary (people quitting jobs) or involuntary (layoffs). Breaking it down, overall hiring has eased. It’s now running around 5.8 million, which matches the 2019 average. However, the labor force is much larger, and hiring as a percent of overall employment is currently at 3.6%. That’s below the 2019 average of 3.9% and matches what we saw all the way back in 2014. Not exactly weak (the hiring rate collapsed below 3% during the 2008-2009 recession), but not too hot either. In other words, it isn’t easy to find a job if you’re looking for one right now, a very different situation from what we saw in 2021/2022 through early 2023.
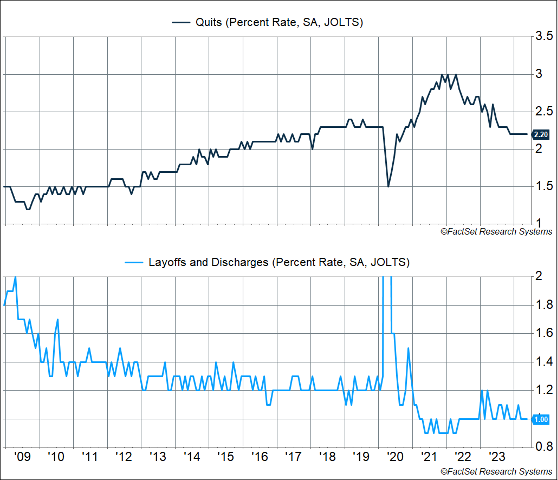
At the same time, “net employment” is high because separations are low. People are quitting their jobs at a much slower pace than before – the “quit rate” has been unchanged at 2.2% for 7 months now. That’s only a tick lower than what we saw in 2019 and is indicative of a healthy employment situation. If the labor market were weak, the quit rate would be much lower. Even better, layoffs are running historically low. As a percent of the employed workforce, the “layoff rate” is at 1%. It averaged 1.2% in 2019, which was considered really low.
What’s likely happening is that companies did a lot of hiring in 2021/2022 (maybe too much) and are now easing up. If companies were truly pessimistic about sales and profits, they would be letting more people go. One positive aspect of this is that workers who stay in their jobs longer get more productive.
The other side of all this is that we’re seeing the unemployment rate inch higher and that’s the most visible sign that the labor market is cooling. The unemployment rate rose to 4.1% in June, up from 3.7% a year ago. That’s still relatively low, but the recent uptrend is not encouraging. Now, part of this is because people who don’t have jobs are looking for work more actively than they did before.
Rather than the unemployment rate, we prefer looking at the “prime-age” (25-54 years) employment-population ratio, since it gets around definitional issues that crop up with the unemployment rate (someone is counted as being “unemployed” only if they’re “actively looking for a job”) or demographics (an aging population has more people retiring and leaving the labor force every day). The prime-age employment population ratio was unchanged at 80.8% in May. That’s only slightly below the high from last summer, and above anything we saw between 2001 and 2019 (when it peaked at 80.4%). This by itself should tell you the labor market is strong, with more people participating in it.
The Fed Needs to Act
The upshot of all those numbers is that the labor market remains healthy, but risks are rising. Once the labor market really starts to weaken, you can get a snowball effect, and it’s hard to tell when it stops. That is why there’s really no such thing as a mild recession — the three recessions prior to the pandemic recession (1991, 2001, 2008-2009) were all bad from an employment perspective, as it took years for the labor market to recover. Once the labor market starts to weaken, the economy gets into a negative feedback loop of low hiring, high layoffs, weak income growth, and falling consumption. At the end of the day, one person’s spending is another person’s income, or company profits. These down cycles can adversely impact the productive capacity of the economy in future years.
This is why the Federal Reserve needs to act and pull back on their economic brake pedal, i.e. high interest rates. Rates are clearly restricting some cyclical activity right, most notably in the housing sector thanks to 7%+ mortgage rates.
Fed Chair Powell recently admitted that the risks to their double mandate – low and stable inflation and stable employment – are now two-sided. He noted that cutting rates too soon could “undo the good work we’ve done bringing down inflation,” but, cutting rates too late “could unnecessarily undermine the expansion.” This two-sided view of the risks is a big change from a year ago.
Powell and other Fed members continue to maintain that they need to gain more confidence that inflation is headed back to their target of 2%. Yet, recent reports have been very encouraging on that front. Inflation is running around 2.5-3% only because of how the government calculates shelter inflation, which really lags real-time, private market data.
At this point, the risks are likely skewed toward the labor market cooling too rapidly than inflation re-heating. The Fed should have enough data to justify starting their rate cut cycle as early as their July meeting in three weeks. However, given their proclivity to waiting, it looks like we’ll have to wait until September. In any case, we’re very likely to see the Fed pull interest rates back this year to help extend the expansion.
This newsletter was written and produced by CWM, LLC. Content in this material is for general information only and not intended to provide specific advice or recommendations for any individual. All performance referenced is historical and is no guarantee of future results. All indices are unmanaged and may not be invested into directly. The views stated in this letter are not necessarily the opinion of any other named entity and should not be construed directly or indirectly as an offer to buy or sell any securities mentioned herein. Due to volatility within the markets mentioned, opinions are subject to change without notice. Information is based on sources believed to be reliable; however, their accuracy or completeness cannot be guaranteed. Past performance does not guarantee future results.
S&P 500 – A capitalization-weighted index of 500 stocks designed to measure performance of the broad domestic economy through changes in the aggregate market value of 500 stocks representing all major industries.
The NASDAQ 100 Index is a stock index of the 100 largest companies by market capitalization traded on NASDAQ Stock Market. The NASDAQ 100 Index includes publicly-traded companies from most sectors in the global economy, the major exception being financial services.
A diversified portfolio does not assure a profit or protect against loss in a declining market.
Compliance Case # 02311458_070824_C


